 ADA Bamboo

Theo dõi Aya Node với Grafana
Hướng dẫn này sẽ hướng dẫn bạn cách thiết lập Prometheus với Grafana để giám sát nút của bạn với bảng điều khiển cơ bản.
Một chuỗi dựa trên Substrate như Aya cho phép truy cập dữ liệu như chiều cao của chuỗi, số lượng các nút ngang hàng được kết nối với nút của bạn, v.v. Để theo dõi dữ liệu này, Prometheus được sử dụng để thu thập số liệu và Grafana cho phép hiển thị chúng trên bảng điều khiển.
Theo thông lệ tốt nhất, bạn nên cài đặt Prometheus và Grafana trên các máy chủ riêng biệt với các node của bạn – theo cách đó, nếu node của bạn ngừng hoạt động, hệ thống vẫn có thể gửi cảnh báo cho bạn. Lý tưởng nhất là chúng nên được kết nối bằng VPN như Tailscale, thay vì chỉ mở các cổng liên quan cho Prometheus và Grafana trên mỗi máy chủ.
Vì mục đích thử nghiệm, bạn có thể chạy Prometheus và Grafana trên cùng một máy chủ với node của mình. Để ngắn gọn, chúng tôi sẽ giả sử đây là trường hợp và do đó hướng dẫn sẽ sử dụng localhost làm địa chỉ cho các máy chủ khác nhau. Đối với thiết lập bảo mật, bạn nên thay thế localhost bằng địa chỉ IP máy chủ liên quan của bạn.
CÁC BƯỚC TRONG HƯỚNG DẪN NÀY DÀNH CHO MỤC ĐÍCH KIỂM TRA – KHÔNG SỬ DỤNG TRONG MÔI TRƯỜNG SẢN XUẤT
I. Thiết lập môi trường
Đầu tiên, hãy tạo một tài khoản người dùng cho Prometheus bằng cách thêm cờ –no-create-home để ngăn Prometheus đăng nhập.
sudo useradd --no-create-home --shell /usr/sbin/nologin prometheusTạo các thư mục cần thiết để lưu trữ các tệp cấu hình và tệp thực thi.
sudo mkdir /etc/prometheus
sudo mkdir /var/lib/prometheus
Thay đổi quyền sở hữu của các thư mục này thành prometheus để chỉ người dùng prometheus mới có thể truy cập chúng.
sudo chown -R prometheus:prometheus /etc/prometheus
sudo chown -R prometheus:prometheus /var/lib/prometheus
1. Cài đặt và Cấu hình Prometheus
Sau khi thiết lập môi trường, hãy cập nhật hệ điều hành của bạn và cài đặt Prometheus phiên bản mới nhất. Bạn có thể kiểm tra bản phát hành mới nhất bằng cách truy cập vào kho lưu trữ GitHub của họ trong trang releases.
sudo apt-get update && apt-get upgrade
wget https://github.com/prometheus/prometheus/releases/download/v2.52.0/prometheus-2.52.0.linux-amd64.tar.gz
tar xfz prometheus-*.tar.gz
cd prometheus-2.52.0.linux-amd64
Có hai tệp nhị phân trong thư mục: prometheus là tệp nhị phân chính của Prometheus, và promtool.
Các thư mục consoles và console_libraries chứa giao diện web, ví dụ các tệp cấu hình và bản quyền.
Sao chép các tệp thực thi vào thư mục /usr/local/bin/.
sudo cp ./prometheus /usr/local/bin/
sudo cp ./promtool /usr/local/bin/
Đổi quyền sở hữu của các file này sang người dùng prometheus.
sudo chown prometheus:prometheus /usr/local/bin/prometheus
sudo chown prometheus:prometheus /usr/local/bin/promtool
Sao chép các thư mục consoles và console_libraries vào thư mục /etc/prometheus.
sudo cp -r ./consoles /etc/prometheus
sudo cp -r ./console_libraries /etc/prometheus
Đổi quyền sở hữu của các thư mục này sang người dùng prometheus.
sudo chown -R prometheus:prometheus /etc/prometheus/consoles
sudo chown -R prometheus:prometheus /etc/prometheus/console_libraries
Sau khi hoàn tất mọi thứ, hãy chạy lệnh này để xóa thư mục prometheus.
cd .. && rm -rf prometheus*Trước khi sử dụng Prometheus, cần cấu hình một chút. Tạo một file cấu hình YAML tên prometheus.yml bằng cách chạy lệnh bên dưới.
sudo nano /etc/prometheus/prometheus.ymlSao chép và dán cấu hình sau vào trình soạn thảo và lưu bằng tổ hợp phím CTRL + X.
Lưu ý:
- Nếu nút Aya của bạn nằm trên một máy chủ khác với Prometheus, hãy thay thế localhost:9615 bằng <YOUR_SERVER_IP_ADDRESS>:9615
- Bạn cũng cần đảm bảo rằng –prometheus-external đã được thêm vào tập tin start_aya_validator.sh.
global:
  scrape_interval: 15s
  evaluation_interval: 15s

rule_files:
  # - "first.rules"
  # - "second.rules"

scrape_configs:
  - job_name: "prometheus"
    scrape_interval: 5s
    static_configs:
      - targets: ["localhost:9090"]
  - job_name: "aya_node"
    scrape_interval: 5s
    static_configs:
      - targets: ["localhost:9615"]
File cấu hình của Prometheus được chia thành ba phần chính: global, rule_files và scrape_configs.
– global/scrape_interval (khoảng thời gian trích xuất): xác định tần suất Prometheus trích xuất dữ liệu từ các đối tượng mục tiêu (target).
– global/evaluation_interval (khoảng thời gian đánh giá): kiểm soát tần suất Prometheus đánh giá các quy tắc.
– rule_files (các file rule): Chứa thông tin về vị trí của bất kỳ quy tắc nào mà chúng tôi muốn máy chủ Prometheus tải.
– scrape_configs (cấu hình trích xuất): chứa thông tin về các tài nguyên mà Prometheus giám sát.
Với file cấu hình ở trên, exporter đầu tiên là exporter mà Prometheus sử dụng để giám sát chính nó. Vì chúng ta muốn có thông tin chính xác hơn về trạng thái của máy chủ Prometheus nên chúng ta đã giảm scrape_interval xuống 5 giây cho tác vụ này. Các tham số static_configs và targets xác định vị trí chạy của các exporter. Exporter thứ hai đang thu thập dữ liệu từ nút Aya của bạn và cổng mặc định là 9615.
Bạn có thể kiểm tra tính hợp lệ của file cấu hình này bằng cách chạy:
promtool check config /etc/prometheus/prometheus.ymlLưu file cấu hình và đổi quyền sở hữu của file này sang người dùng prometheus.
sudo chown prometheus:prometheus /etc/prometheus/prometheus.yml2. Khởi động Prometheus
Để kiểm tra xem Prometheus đã được thiết lập chính xác chưa, hãy thực hiện lệnh sau để khởi chạy nó với tư cách là người dùng prometheus.
sudo -u prometheus /usr/local/bin/prometheus --config.file /etc/prometheus/prometheus.yml --storage.tsdb.path /var/lib/prometheus/ --web.console.templates=/etc/prometheus/consoles --web.console.libraries=/etc/prometheus/console_librariesCác thông báo sau đây cho biết trạng thái của máy chủ Prometheus. Nếu bạn thấy các thông báo sau, máy chủ của bạn đã được thiết lập chính xác.
level=info ts=2021-04-16T19:02:20.167Z caller=main.go:380 msg="No time or size retention was set so using the default time retention" duration=15d
level=info ts=2021-04-16T19:02:20.167Z caller=main.go:418 msg="Starting Prometheus" version="(version=2.26.0, branch=HEAD, revision=3cafc58827d1ebd1a67749f88be4218f0bab3d8d)"
level=info ts=2021-04-16T19:02:20.167Z caller=main.go:423 build_context="(go=go1.16.2, user=root@a67cafebe6d0, date=20210331-11:56:23)"
level=info ts=2021-04-16T19:02:20.167Z caller=main.go:424 host_details="(Linux 5.4.0-42-generic #46-Ubuntu SMP Fri Jul 10 00:24:02 UTC 2020 x86_64 ubuntu2004 (none))"
level=info ts=2021-04-16T19:02:20.167Z caller=main.go:425 fd_limits="(soft=1024, hard=1048576)"
level=info ts=2021-04-16T19:02:20.167Z caller=main.go:426 vm_limits="(soft=unlimited, hard=unlimited)"
level=info ts=2021-04-16T19:02:20.169Z caller=web.go:540 component=web msg="Start listening for connections" address=0.0.0.0:9090
level=info ts=2021-04-16T19:02:20.170Z caller=main.go:795 msg="Starting TSDB ..."
level=info ts=2021-04-16T19:02:20.171Z caller=tls_config.go:191 component=web msg="TLS is disabled." http2=false
level=info ts=2021-04-16T19:02:20.174Z caller=head.go:696 component=tsdb msg="Replaying on-disk memory mappable chunks if any"
level=info ts=2021-04-16T19:02:20.175Z caller=head.go:710 component=tsdb msg="On-disk memory mappable chunks replay completed" duration=1.391446ms
level=info ts=2021-04-16T19:02:20.175Z caller=head.go:716 component=tsdb msg="Replaying WAL, this may take a while"
level=info ts=2021-04-16T19:02:20.178Z caller=head.go:768 component=tsdb msg="WAL segment loaded" segment=0 maxSegment=4
level=info ts=2021-04-16T19:02:20.193Z caller=head.go:768 component=tsdb msg="WAL segment loaded" segment=1 maxSegment=4
level=info ts=2021-04-16T19:02:20.221Z caller=head.go:768 component=tsdb msg="WAL segment loaded" segment=2 maxSegment=4
level=info ts=2021-04-16T19:02:20.224Z caller=head.go:768 component=tsdb msg="WAL segment loaded" segment=3 maxSegment=4
level=info ts=2021-04-16T19:02:20.229Z caller=head.go:768 component=tsdb msg="WAL segment loaded" segment=4 maxSegment=4
level=info ts=2021-04-16T19:02:20.229Z caller=head.go:773 component=tsdb msg="WAL replay completed" checkpoint_replay_duration=43.716µs wal_replay_duration=53.973285ms total_replay_duration=55.445308ms
level=info ts=2021-04-16T19:02:20.233Z caller=main.go:815 fs_type=EXT4_SUPER_MAGIC
level=info ts=2021-04-16T19:02:20.233Z caller=main.go:818 msg="TSDB started"
level=info ts=2021-04-16T19:02:20.233Z caller=main.go:944 msg="Loading configuration file" filename=/etc/prometheus/prometheus.yml
level=info ts=2021-04-16T19:02:20.234Z caller=main.go:975 msg="Completed loading of configuration file" filename=/etc/prometheus/prometheus.yml totalDuration=824.115µs remote_storage=3.131µs web_handler=401ns query_engine=1.056µs scrape=236.454µs scrape_sd=45.432µs notify=723ns notify_sd=2.61µs rules=956ns
level=info ts=2021-04-16T19:02:20.234Z caller=main.go:767 msg="Server is ready to receive web requests."
Trên trình duyệt web, hãy truy cập vào http://YOUR_SERVER_IP_ADDRESS:9090/graph để kiểm tra xem bạn có thể truy cập giao diện Prometheus hay không. Nếu nó hoạt động trong trình duyệt của bạn, hãy thoát tiến trình bằng cách nhấn tổ hợp phím CTRL + C.
Lưu ý: Để kiểm tra kết nối này, bạn cần quyền truy cập vào cổng 9090 trên máy chủ của mình.
Tiếp theo, chúng ta muốn tự động khởi động máy chủ Prometheus trong quá trình khởi động hệ thống, vì vậy chúng ta cần tạo một tệp cấu hình systemd mới:
sudo nano /etc/systemd/system/prometheus.serviceSao chép và dán cấu hình sau vào trình soạn thảo và lưu bằng tổ hợp phím CTRL + X.
[Unit]
  Description=Prometheus Monitoring
  Wants=network-online.target
  After=network-online.target

[Service]
  User=prometheus
  Group=prometheus
  Type=simple
  ExecStart=/usr/local/bin/prometheus \
  --config.file /etc/prometheus/prometheus.yml \
  --storage.tsdb.path /var/lib/prometheus/ \
  --web.console.templates=/etc/prometheus/consoles \
  --web.console.libraries=/etc/prometheus/console_libraries
  ExecReload=/bin/kill -HUP $MAINPID

[Install]
  WantedBy=multi-user.target
Sau khi lưu file, hãy thực hiện lệnh bên dưới để tải lại systemd và kích hoạt dịch vụ để nó tự động được nạp khi hệ thống khởi động.
sudo systemctl daemon-reload && systemctl enable prometheus && systemctl start prometheusPrometheus bây giờ đã khởi chạy và bạn có thể truy cập lại giao diện của nó bằng cách truy cập lại vào http://YOUR_SERVER_IP_ADDRESS:9090/graph
3. Cài đặt Node Exporter cho Prometheus
Đây là bước tùy chọn, nhưng được khuyến khích vì nó cho phép chúng tôi thu thập số liệu hệ thống như sử dụng CPU và RAM từ mỗi máy chủ chạy Aya-Node. Nếu bạn không muốn xem số liệu hệ thống nút của mình trên bảng điều khiển Grafana, thì hãy chuyển sang phần cài đặt Grafana.
Node Exporter là một chương trình trung gian giúp thu thập các số liệu hệ thống và hiển thị chúng theo định dạng mà Prometheus có thể đọc hiểu. Node Exporter là một dự án được bảo trì bởi cùng nhóm phát triển Prometheus. Đây là bước hoàn toàn tùy chọn và bạn có thể bỏ qua nếu không muốn thu thập số liệu hệ thống. Các bước sau đây cần được thực hiện trên từng máy chủ mà bạn muốn giám sát các số liệu hệ thống.
a. Tải xuống Node Exporter
Tải xuống tệp nhị phân Node Exporter cho mỗi máy chủ mà bạn muốn giám sát.
wget https://github.com/prometheus/node_exporter/releases/download/v1.8.1/node_exporter-1.8.1.linux-amd64.tar.gzTruy cập trang tải xuống của Prometheus để lấy phiên bản mới nhất. (https://prometheus.io/download/)
b. Tạo User
Tạo người dùng Node Exporter, các thư mục cần thiết và đặt người dùng Node Exporter làm chủ sở hữu của những thư mục đó
sudo groupadd -f node_exporter
sudo useradd -g node_exporter --no-create-home --shell /bin/false node_exporter
sudo mkdir /etc/node_exporter
sudo chown node_exporter:node_exporter /etc/node_exporterGiải nén và di chuyển tệp nhị phân Node Exporter đã tải xuống.
tar -xvf node_exporter-1.8.1.linux-amd64.tar.gz
mv node_exporter-1.8.1.linux-amd64 node_exporter-files
d. Cài đặt Node Exporter
Sao chép tệp nhị phân node_exporter từ thư mục node_exporter-files đến thư mục /usr/bin và thay đổi quyền sở hữu của tệp này sang người dùng prometheus.
sudo cp node_exporter-files/node_exporter /usr/bin/
sudo chown node_exporter:node_exporter /usr/bin/node_exporter
Tạo file dịch vụ node_exporter.
sudo nano /usr/lib/systemd/system/node_exporter.serviceSao chép và dán cấu hình sau vào trình soạn thảo văn bản, sau đó lưu bằng tổ hợp phím CTRL + X.
[Unit]
Description=Node Exporter
Documentation=https://prometheus.io/docs/guides/node-exporter/
Wants=network-online.target
After=network-online.target

[Service]
User=node_exporter
Group=node_exporter
Type=simple
Restart=on-failure
ExecStart=/usr/bin/node_exporter \
  --web.listen-address=:9100

[Install]
WantedBy=multi-user.target
Sau đó chạy lệnh sau:
sudo chmod 664 /usr/lib/systemd/system/node_exporter.serviceTải lại dịch vụ systemd để đăng ký dịch vụ Prometheus và khởi động dịch vụ Prometheus.
sudo systemctl daemon-reload
sudo systemctl start node_exporter
Kiểm tra trạng thái dịch vụ node exporter bằng lệnh sau:
sudo systemctl status node_exporterVí dụ về đầu ra: (Nhấn CTRL + C để thoát)
• node_exporter. service - Node Exporter
  Loaded: loaded (/usr/lib.systemmd/system/node_expoerter_service; enabled; vender preset: disabled)
  Active: active (running) Tue 2024-05-18 17:04:17 UTC; since 17h ago
    Docs: https://prometheus.io/docs/guides/node-exporter/
Main PID: 27646 (node_exporter)
  CGroup: /system.slice/node_exporter.service
            -27646 /usr/local/bin/node_exporter --web.listen-address=:9100
Cấu hình Node Exporter khởi động cùng hệ thống
sudo systemctl enable node_exporter.serviceNếu tường lửa firewalld được kích hoạt và đang chạy, hãy thêm quy tắc cho cổng 9100.
sudo ufw allow proto tcp from any to any port 9100
sudo ufw reload
e. Xác minh Node Exporter đang hoạt động
Để kiểm tra xem Node Exporter đang chạy, bạn có thể truy cập vào endpoint /metrics của nó trên cổng 9100 của cùng một máy chủ.
http://YOUR_SERVER_IP_ADDRESS:9100/metricsBạn có thể thấy nội dung tương tự như sau:
# HELP go_gc_duration_seconds A summary of the GC invocation durations.
# TYPE go_gc_duration_seconds summary
go_gc_duration_seconds{quantile="0"} 0
go_gc_duration_seconds{quantile="0.25"} 0
go_gc_duration_seconds{quantile="0.5"} 0
go_gc_duration_seconds{quantile="0.75"} 0
go_gc_duration_seconds{quantile="1"} 0
go_gc_duration_seconds_sum 0
go_gc_duration_seconds_count 0
# HELP go_goroutines Number of goroutines that currently exist.
# TYPE go_goroutines gauge
go_goroutines 7
# HELP go_info Information about the Go environment.
# TYPE go_info gauge
go_info{version="go1.12.5"} 1
# HELP go_memstats_alloc_bytes Number of bytes allocated and still in use.
# TYPE go_memstats_alloc_bytes gauge
go_memstats_alloc_bytes 919280
...
f. Clean Up
Xóa các tệp tin đã tải xuống và các tệp tin tạm thời.
rm -rf node_exporter-1.8.0.linux-amd64.tar.gz node_exporter-filesBây giờ chúng ta cần chỉnh sửa file cấu hình YAML của Prometheus để Prometheus trích xuất dữ liệu từ Node Exporter đang chạy trên cổng 9100. Chúng ta sẽ thêm một target mới vào aya-node hiện có.
sudo nano /etc/prometheus/prometheus.ymlThêm “localhost:9100” vào aya_nodes và lưu cấu hình bằng tổ hợp phím CTRL + X
Lưu ý: Nếu Node Exporter của bạn đang chạy trên một máy chủ khác với Prometheus hãy thay thế localhost:9100 bằng <your-nodes-ipaddress>:9100
global:
  scrape_interval: 15s
  evaluation_interval: 15s

rule_files:
  # - "first.rules"
  # - "second.rules"

scrape_configs:
  - job_name: "prometheus"
    scrape_interval: 5s
    static_configs:
      - targets: ["localhost:9090"]
  - job_name: "aya_node"
    scrape_interval: 5s
    static_configs:
      - targets: ["localhost:9615","localhost:9100"]
Khởi động lại Prometheus service.
sudo systemctl restart prometheusII cài đặt Grafana
Để trực quan hóa các chỉ số node của bạn, bạn có thể sử dụng Grafana để truy vấn máy chủ Prometheus. Chạy các lệnh sau để cài đặt.
sudo apt-get install -y adduser libfontconfig1 musl
wget https://dl.grafana.com/oss/release/grafana_11.0.0_amd64.deb
sudo dpkg -i grafana_11.0.0_amd64.deb
Nếu mọi thứ đều ổn, hãy cấu hình Grafana để tự động khởi động khi máy tính bật và sau đó khởi động dịch vụ.
sudo systemctl daemon-reload
sudo systemctl enable grafana-server
sudo systemctl start grafana-server
Bạn có thể truy cập Grafana bằng cách vào địa chỉ http://YOUR_SERVER_IP_ADDRESS:3000/login trên trình duyệt của bạn. Tên người dùng và mật khẩu mặc định là admin/admin. Bạn nên thay đổi mật khẩu này!!
LƯU Ý: Nếu bạn muốn thay đổi cổng mà Grafana chạy (3000 là một cổng phổ biến), hãy chỉnh sửa tệp /usr/share/grafana/conf/defaults.ini bằng lệnh như sudo nano /usr/share/grafana/conf/defaults.ini và thay đổi giá trị http_port thành một giá trị khác. Sau đó khởi động lại grafana với lệnh sudo systemctl restart grafana-server.
a. Set Up Grafana
Đầu tiên chúng ta cần chọn một nguồn dữ liệu. Đi tới Connections > Add new connection. Tìm kiếm Prometheus và chọn nó.

Trên màn hình tiếp theo, hãy nhấp vào nút “Add New Data Source” .
Bây giờ bạn sẽ cần nhập địa chỉ http://<your_actual_node_IP_address:9090> – sử dụng localhost sẽ không hoạt động.
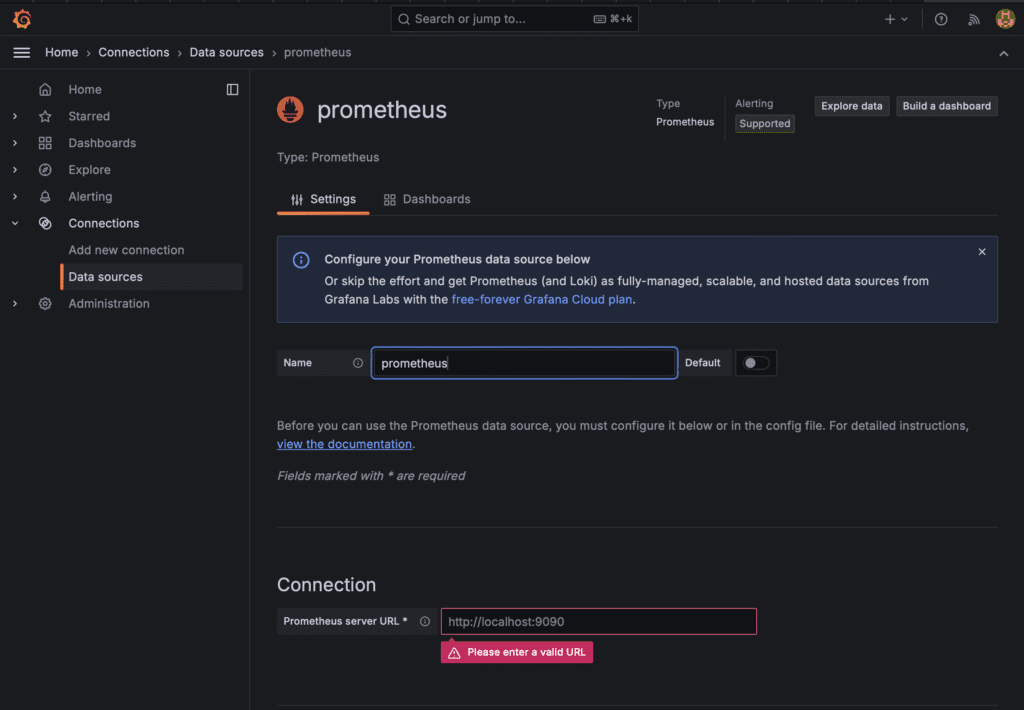
Cuộn xuống cuối trang và nhấp vào “Save and Test”. Hy vọng bạn sẽ nhận được thông báo rằng việc kiểm tra đã thành công!
b. Cài đặt bảng theo dõi đầu tiên của bạn.
Tải xuống tệp aya_node_template.json về máy tính của bạn tại đây.
Trong Grafana, nhấp vào “Dashboards” ở thanh menu bên trái, sau đó nhấp vào “New” và chọn “import” từ menu thả xuống.
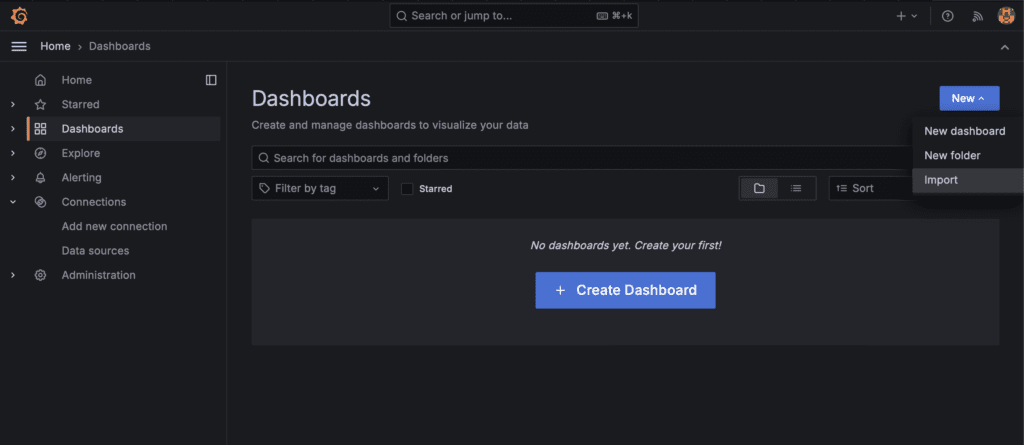
Bây giờ, hãy tải lên tệp aya_node_template.json bằng cách kéo nó từ máy tính của bạn vào cửa sổ Grafana.
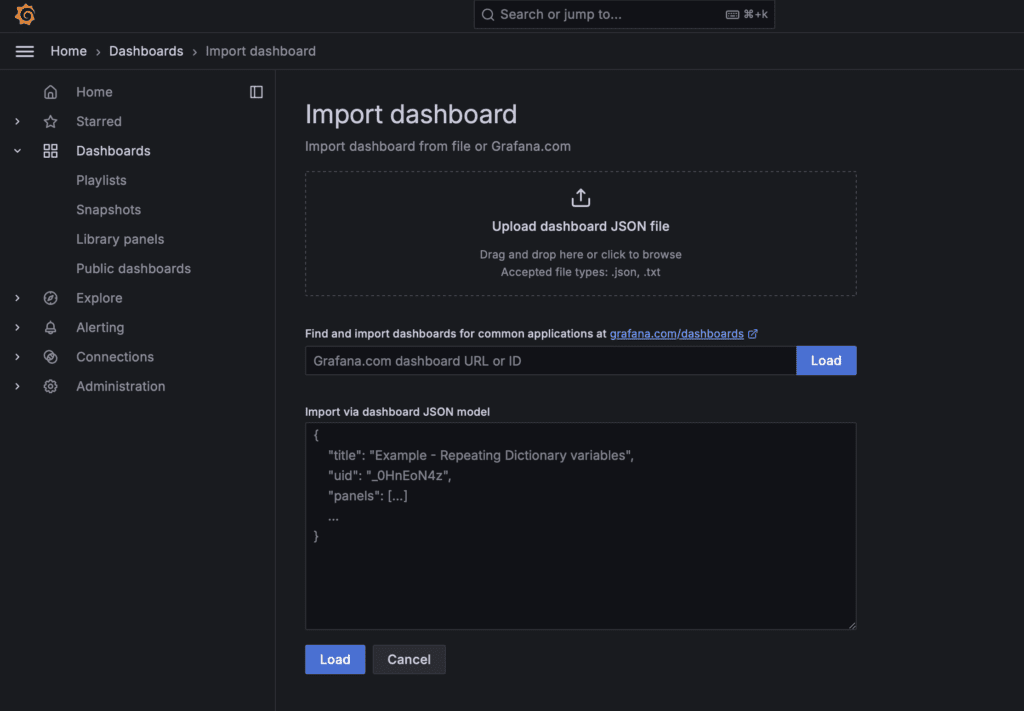
Click Load
Bảng theo dõi của bạn sẽ trông như thế này.
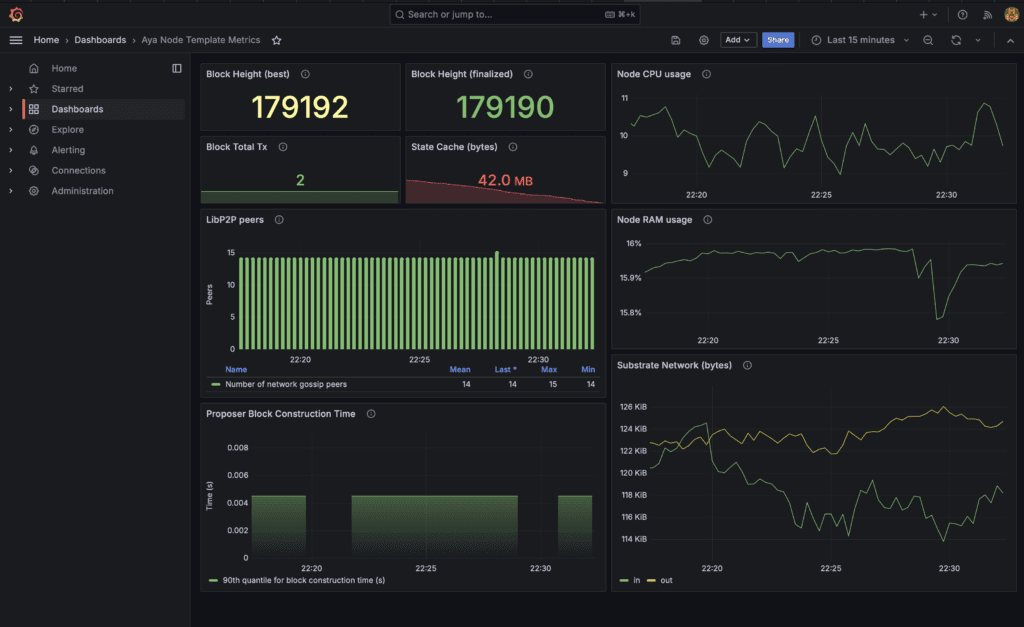
LƯU Ý – Nếu các bảng điều khiển hiển thị “không có dữ liệu”, bạn cần cập nhật nguồn dữ liệu Prometheus mới của mình.
Trong trường hợp này, hãy chỉnh sửa một bảng điều khiển bằng cách nhấp vào 3 chấm ở góc trên bên phải và chọn “Edit”.
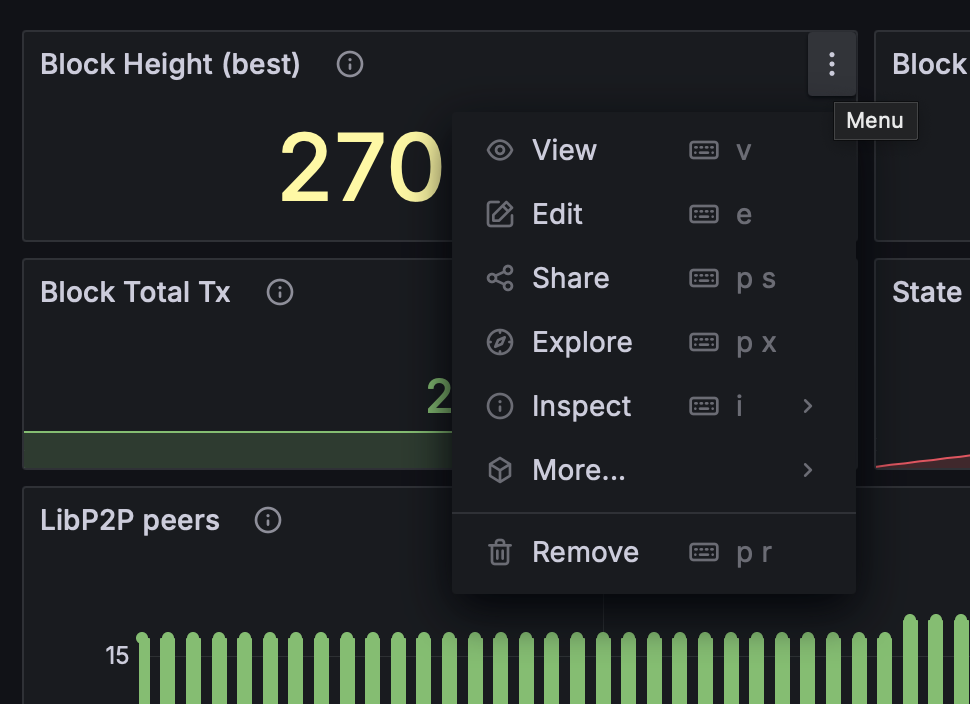
Sau đó, chọn nguồn dữ liệu Prometheus của bạn từ danh sách trong phần “Query”. Bạn có thể thấy rằng bạn cần nhấp vào truy vấn, gõ một khoảng trắng và sau đó xóa khoảng trắng để làm mới truy vấn.
Nếu nguồn dữ liệu của bạn vẫn không tải được, hãy thử quy trình này.
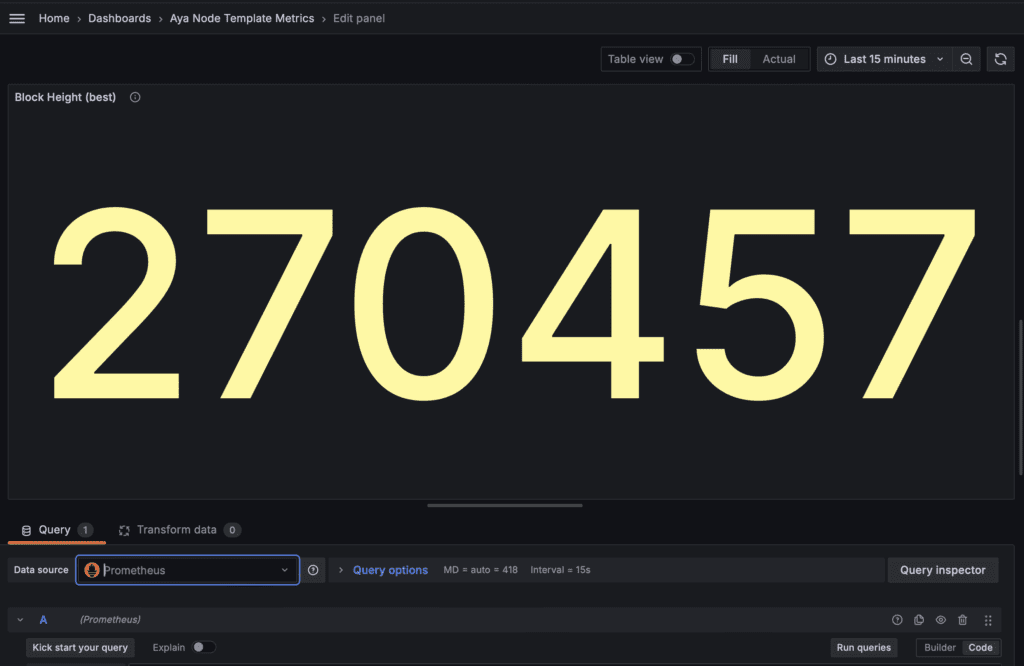
– Chỉnh sửa từng bảng điều khiển.
– Nút chạy Queries có màu xám
– Vào phần trình duyệt Metrics và chỉ cần thêm một ký tự ngẫu nhiên vào cuối giá trị và xóa lại
ví dụ. chất nền_block_height{status=”best”} -> chất nền_block_height{status=”best”}x -> chất nền_block_height{status=”best”}
– Thao tác này sẽ kích hoạt nút Chạy truy vấn, chuyển nút này thành màu xanh lam. Nhấp vào nó và bạn sẽ thấy nó hoạt động bình thường.
– Áp dụng trên mỗi bảng và Lưu Dashboard ở cuối